Step-by-Step Guide
Keeping an eye on your storage usage is essential — especially before you run out of space unexpectedly. In this guide, you’ll learn how to set up a PRTG REST Custom v2 sensor to monitor your Hetzner Storage Box in real time, including used space, snapshot usage, and a percentage-based alert when capacity runs low.
Prerequisites
Before you begin, make sure you have:
- A running PRTG Network Monitor instance
- A Hetzner API token with read access
- Your Storage Box ID (visible in the Hetzner Cloud Console)
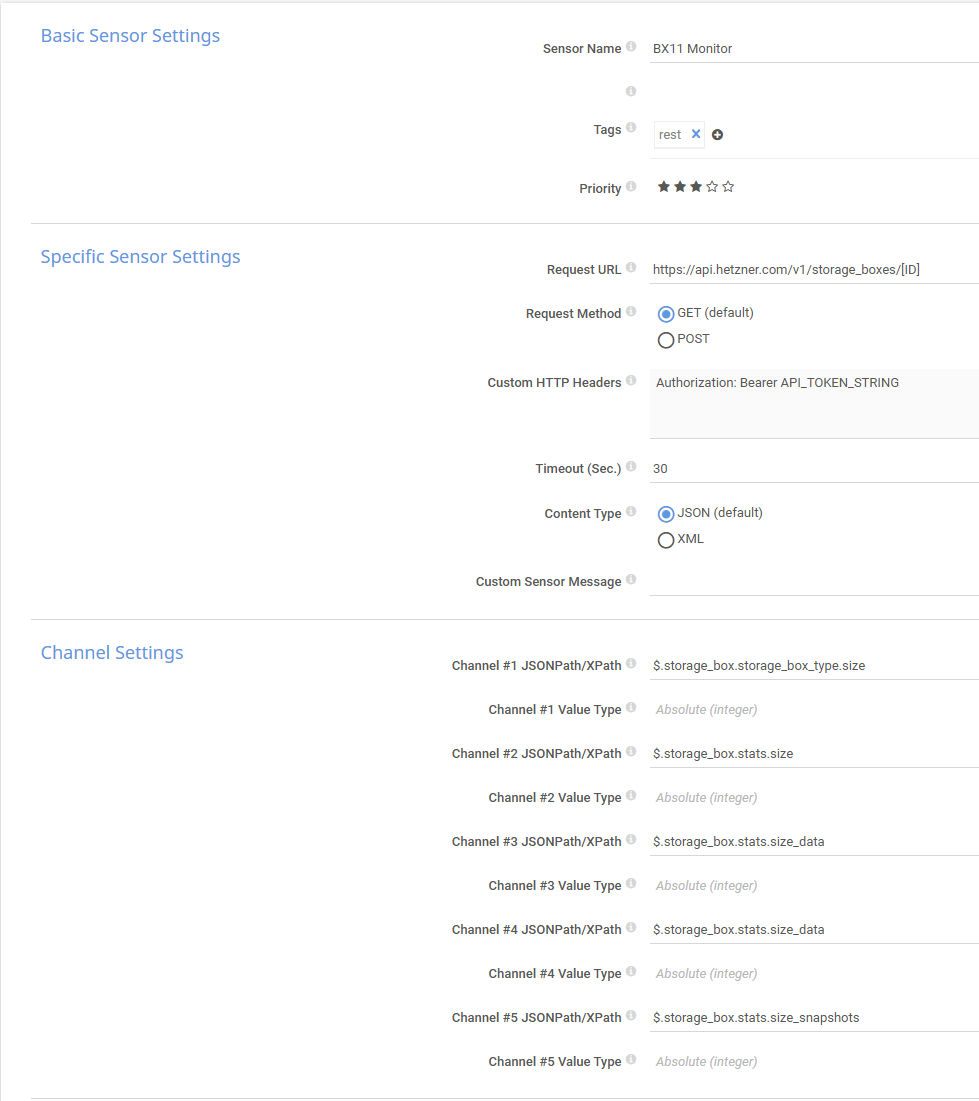
Step 1: Add a New REST Custom v2 Sensor
In PRTG, navigate to the device where you want to add the sensor, click Add Sensor, and search for REST Custom v2.
Fill out the sensor form with the following values:
| Field | Value |
|---|---|
| Request URL | https://api.hetzner.com/v1/storage_boxes/[YOUR_STORAGE_BOX_ID] |
| Custom HTTP Headers | Authorization: Bearer YOUR_API_TOKEN |
Replace
[YOUR_STORAGE_BOX_ID]with your actual Storage Box ID andYOUR_API_TOKENwith your Hetzner API token.
Step 2: Configure the Channels
Add the following five channels to capture all relevant storage metrics:
Channel 1 — Total Available Size
JSONPath: $.storage_box.storage_box_type.size
Name: Available Size | Value Type: Integer | Unit: Bytes (Disk)
Channel 2 — Total Used Space
JSONPath: $.storage_box.stats.size
Name: Used (Total) | Value Type: Integer | Unit: Bytes (Disk)
Channel 3 — Used Data Space
JSONPath: $.storage_box.stats.size_data
Name: Used Data | Value Type: Integer | Unit: Bytes (Disk)
Channel 4 — Used Data (Percentage)
JSONPath: $.storage_box.stats.size_data
Name: Used Data % | Value Type: Integer | Unit: Bytes (Disk)
This channel will be configured to show a percentage value in the next step.
Channel 5 — Snapshot Usage
JSONPath: $.storage_box.stats.size_snapshots
Name: Used Snapshots | Value Type: Integer | Unit: Bytes (Disk)
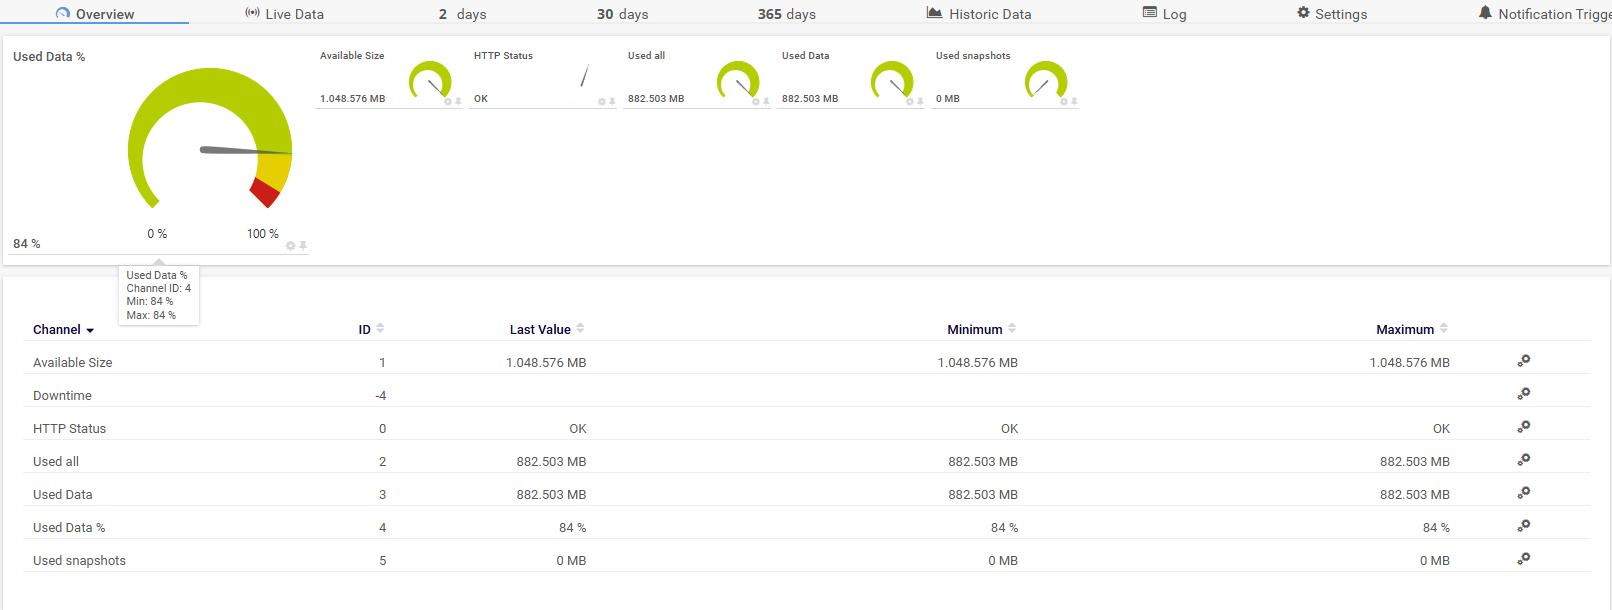
Step 3: Configure the Percentage Channel
Once the sensor is saved and collecting data, you need to fine-tune the Used Data % channel to display a meaningful percentage value.
- Open the sensor overview and click Edit on the Used Data % channel.
- Under Data, switch the display mode to “Display in percent of maximum”.
- Enter the maximum size of your Storage Box as the reference value (e.g.,
1099511627776for a 1 TB box).
This will give you an accurate percentage of how full your storage is, rather than a raw byte value.
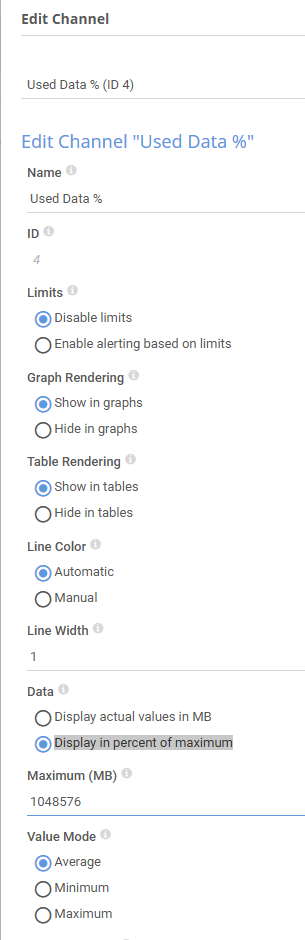
Edit Channel
Step 4: Set Up an Alert Trigger
Now that the sensor is running, add a notification trigger so you get alerted before your storage fills up completely.
- Go to the sensor and click “Notification Triggers”.
- Add a new Threshold Trigger with the following settings:
| Setting | Value |
|---|---|
| Channel | Used Data % (Byte) |
| Condition | Is above 95 |
| Duration | For at least 60 seconds |
| Action | Send Email & Push Notification to Admin |
| When cleared | Send Email & Push Notification to Admin |

This example alerts when more than 95% of capacity is used (less than 5% free). Adjust the threshold to match your own requirements — for example, use 90 if you want to be warned when less than 10% remains.
Summary
With this setup, PRTG will continuously poll the Hetzner API and give you full visibility into your Storage Box usage — broken down by data and snapshots — with a clear percentage view and proactive alerting before you run into capacity issues.
If you found this guide helpful, feel free to share it or leave a comment below!
Leave A Comment